


CPU usage is the most crucial concern for any OS to maintain the system’s performance. Checking CPU usage helps users figure out the processes that utilize excessive resources and create performance issues. Linux provides multiple methods to find CPU usage via command line utilities.
Contents
Today, this guide will enlist possible methods to find CPU usage in Linux.
Method 1: Check CPU Usage with top and htop Command
The “top” is the built-in utility of Linux for administrative users. It displays the real-time background running processes. So, it can be considered to check the CPU usage. To obtain its results, run the “top” command in the terminal as stated:
top
The output has displayed the “%CPU(s)” section showing the different types of resources (0.7, 0.3….), in percentage being used by the processes. These are explained in the following table:
| Resources | Explanation |
| us | Represents the percent time for user processes. |
| sy | Represents the percent time for kernel processes. |
| id | Represents the percent time for the idle state. |
| wa | Represents the percent waiting time for the I/O. |
| hi | Represents the percent time for hardware interrupts |
| si | Represents the percent time for software interrupts |
| st | Represents the percent waiting time for the virtual CPU time to approach the physical CPU. |
Moreover, you will see the list of processes and CPU usage percentages.
“htop” is the more enhanced version of the top command that displays the output in a colorized and visual format. The output of the htop command is obtained as follows:
htop
Method 2: Check CPU Usage with mpstat Command
The “mpstat” is a popular command line utility in Linux that displays the overall CPU statistics. This command comes with the installation of the sysstat tool. Here are the commands for installing the sysstat tool for various Linux distros:
sudo apt install sysstat            #For Debian/Ubuntu
sudo up2date install sysstat        #For Older Distros of CentOS/RHEL
sudo yum install sysstat            #For Newer Distros of CentOS/RHEL
Once the mpstat command is installed, run it in the terminal as follows:
mpstat
The output indicates the number of bits and cores the processor has i.e. _x86_64_ and (2 CPU). While the output columns for the mpstat command are defined in the given table.
| Column Name | Explanation |
| %usr | Usage percentage user processes |
| %nice | Usage percentage for nice process (priority) |
| %sys | Usage percentage of kernel processes |
| %iowait | Usage percentage of input-output |
| %irq | Usage percentage of hardware interrupts processes. |
| %soft | Usage percentage of software interrupt processes |
| %steal | Usage percentage of handling other virtual processors |
| %guest | Usage percentage of running other virtual processors. |
| %gnice | Usage percentage of nice guest processes. |
| %idle | Usage percentage of CPU for idle state |
Method 3: Check CPU Usage with iostat Command
The “iostat” stands for Input-Output Statistics. It displays the input-output statistics for all devices either physical or logical. This utility comes with the installation sysstat tools, see method 2 for the installation command.
After installing, run iostat in the terminal:
iostat
The highlighted section in the above image shows the CPU usage for the Linux processes.
Method 4: Check CPU Usage with vmstat Command
The “vmstat” command in Linux tells the user about statistics for various activities such as CPU, memory, paging, block I/O, and disks. Same as iostat and mpstat commands, it comes with sysstat package installation. Run the vmstat in the terminal to retrieve the CPU usage details:
vmstat
The user can check the ”cpu” section shows the resource usage for the processes “us” (0), “sy” (0), “id” (100), “wa” (0), and “st” (0).
Additionally, you can specify the time duration in seconds for real-time monitoring. For instance, the command will report the statistics every 2 seconds.
vmstat 2
The CPU process usage for the processes “us”, “sy”, “id”, “wa”, and “st” is prompted.
Note: To cancel the real-time monitoring of the vmstat command, press the key combo “Ctrl+C” to stop it.
Method 5: Check CPU Usage with nmon Command
The “nmon” is the system monitoring tool in Linux that displays the performance of various components such as CPU, memory, disks, network, and more. Moreover, the tool has a user-friendly interface, and command guidance is written for desired results. To install this tool in Linux, use the provided command according to your Linux distros:
sudo apt install nmon                   #For Debian/Ubuntu
sudo yum install nmon                   #For Fedora
sudo dnf install nmon                   #For CentOS/RHEL
Once installed, run the nmon command in the terminal:
nmon
From the above-given interface, press c for CPU performance/utilization:

The CPU utilization is printed on the screen and the average usage for the CPU 1 and 2 processes are “User%”, “Sys%”, “wait%”, and “Idle” are “1.0”, “0.0”, “0.0”, and “99.0”.
Method 6: Check CPU Usage with sar Command
The “sar” stands for System Activity Report. Since it generates the report activities for various system components, you can consider it for generating the CPU performance report. As far as its installation process is concerned, it comes with a sysstat tool package.
Before using the sar command, make sure you have started and enabled the sysstat service. To do this, run these commands:

Example 1: Show Run-time CPU Usage
Use the “-u” flag with the sar command and define the time interval for displaying the performance. For instance, the provided command will display the CPU report 5 times after 3 seconds. Additionally, it will also tell the average performance during this time:
sar -u 3 5
The CPU performance report is listed, and the average usage for “%user”, “%nice”, “%system”, “%iowait”, “%steal”, and “%idle” processes; are “0.34”, “0.00”, “0.47”, “0.00”, “0.00”, “99.19”
Example 2: Get Statistics Report For Specific Processor
Likewise, the user can get the statistics report for the specific processors, using the “-P” flag. Specify the processor (i.e. 0 for processor 1, 1 for processor 2….). As proof, the given command will print the statistics report 3 times, every 2 seconds for the processor CPU 0:
sar -P 0 2 3
This time, the average processes for CPU 0 are listed.
Method 7: Check CPU Usage with glances Command
Like a top command, glances is also a powerful Linux resource to observe the system’s performance. The good thing about this command-line utility is to highlight the processes consuming more resources. The following are the commands for the installation of the glances utility:
sudo apt install glances             #For Debian/Ubuntu
sudo yum install glances             #For CentOS/RHEL
After installation, type and run the glances command in the shell for the overall look at the system performance
glances
From the above output, the CPU usage can be checked easily. In our case, the CPU “user” processes are using 1.2% while the total usage is 7.1%.
Method 8: Check CPU Usage with dstat Command
“dstat” is another popular command line tool launched to replace the iostat, vmstat, and ifstat commands. It helps the user monitor the resources used by the CPU’s various components. Use the following command, to install this tool in Linux:
sudo apt install dstat                            #For Debian/Ubuntu
sudo yum install -y dstat                         #For Fedora/CentOS/RHEL
Once installed, run the “dstat” command with “-c” (represents CPU) and “–top-cpu” (for expensive CPU processes) flags:
dstat -c --top-cpu
The CPU utilization is printed such as the “gnome-shell” and “kworker” processes using 0.1% and 0.5% of the CPU and so on.
Method 9: Check CPU Usage with ps Command
“ps” (Process Status) is the built-in command in Linux that enlists the running processes in the system. The following ps command displays the processes along with pid (process id), ppid (parent process id), %cpu (CPU usage), %mem (memory usage), and cmd (command). Here, “-eo” flags are for all and overload processes:
ps -eo pid,ppid,%cpu,%mem,cmd --sort=-%cpu

From the above image, the user can find the processes are utilizing more resources of the CPU.
Method 10: Check CPU Usage with Gnome System Monitor (GUI)
Gnome desktop has a system monitor tool to check the performance of your system and It can be considered for monitoring CPU usage.
Launch the gnome system monitor tool from the applications:

After launching, the user can check the CPU usage for all processes in the “%CPU” column:

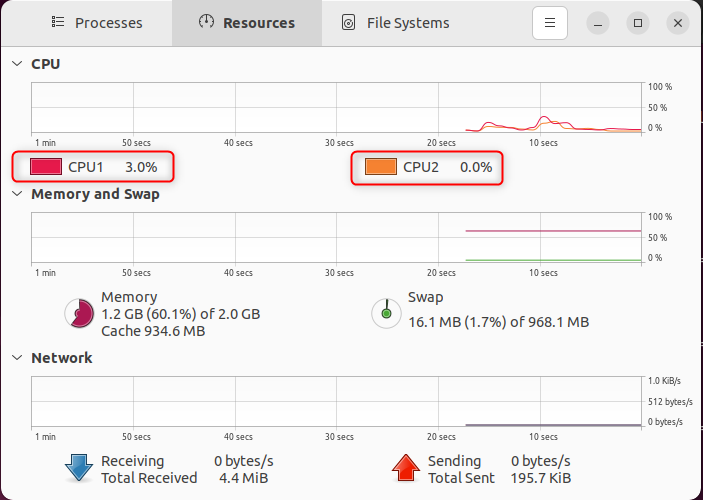
Additionally, open the “Resource” tab to check the graph representation for the resources being used:
Final Look
Linux offers a wide range of command-line utilities to measure CPU performance including top, htop, mpstat, iostat, vmstat, nmon, sar, glances, dstat, and ps. Use any of the command line utilities to measure your Linux CPU usage. Some of the utilities like mpstat, iostat, vmstat,sar, and dstat come with the systool package. Furthermore, a GUI gnome system monitor tool can also be utilized for finding the CPU usage.
In this guide, we have demonstrated possible ways to find Linux CPU usage using the command line.
